Description
T3 Live – Hit & Run 2.0 Swing Trading Evolved by Jeff Cooper
Follow a professional trader each day.
Which do you want to be? Chart reader or trader? They’re not the same.
Reading charts and earning money are different skills.
There’s a big gap between technical analysis and getting paid. Some say it’s a small gap in knowledge, and that may be true. But if you never fill that gap… it can suck years and tens of thousands of dollars out of your life.
Trust me. I’ve been there. There’s nothing worse than being close. Nothing more exhausting than feeling the pressure of a “real job” breathing down your neck. If you’re ready, now is the time to learn what works.
I want to help you become a profitable trader. For that to happen, I need to explain each of my patterns in detail. I need to give you the proper context for WHY they work. I need to give you my experience.
Without this knowledge, you hesitate and find success elusive.
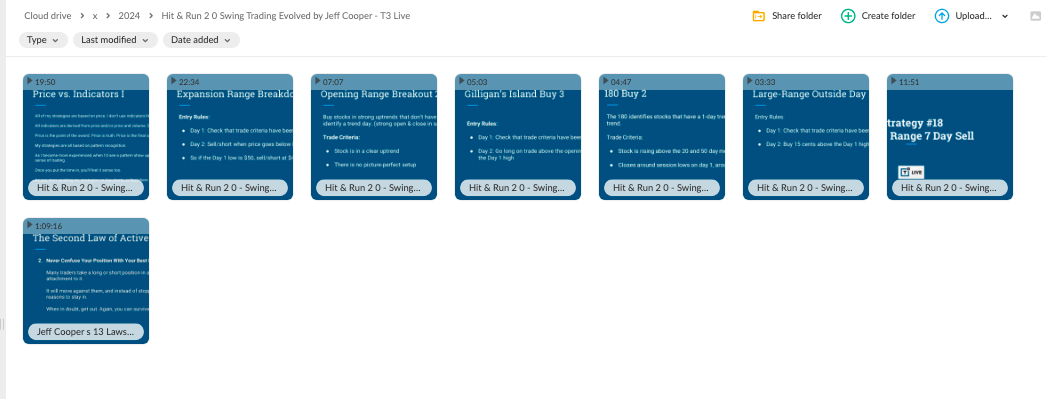
Since I’m not available for personal coaching, we need to get you started on my training videos. The short home-study videos explain my 13 Laws of Active Trading, and then move into a detailed lesson for each trading pattern.
Since you’ve made it this far, I’m willing to bet you’re a far cry from the CONSISTENT and PREDICTABLE income growth that you desperately want.
Time to fulfill your potential.
Not only do I want you to have the CONFIDENCE to double down on a consistent trading strategy that you feel good about…
…But I want to get you fully up to speed on the trades working RIGHT NOW, so that you can focus your time and energy only on what will have you waking up to a positive P&L each month…
… instead of slipping into overwhelm trying to learn from trial and error.
The Patterns that Produce the Profits.

A low-risk, potentially high reward strategy used for continuation plays. The Lizard is useful for buying strongly trending stocks going through temporary weakness.
This strategy works because the setup is an exhaustion setup. This means that the last buyers or sellers push the stock to extremes before the smart money moves in. Because these markets are making short term highs and lows, the reversals tend to be fast and furious.

We can’t buy every new high so we need to qualify each one. I have found that the most explosive breakouts have an expansion in range when reaching a very specific level.
This pattern sets up from a little-known expansion point discovered in the early 1940’s. These plays have shown to have the most consistent profits over a one-to-five-day time frame.

One of the toughest predicaments you’ll face is deciding when to enter runaway stocks. (An extremely strong trend and parabolic momentum). Most of us have identified times where we’ve identified a stock where we wanted to go long (or short), but because the stock was moving so quickly, we never got the chance.
The 123 PB is my antidote for this problem. Strongly trending stocks must take a breather now and again. I’ve discovered that not all “pauses” are created equal. The most powerful trades rest for a certain amount of days before resuming their underlying trend.
Once the big buyers get active again, the stock quickly races to new levels. Identifying these trades before the explosion is my specialty.

Pullbacks in strongly trending stocks tend to gravitate to the same moving average with scary consistency. Once this particular moving average is kissed, a reversal back in the direction of the prevailing trend gives you an easy trade to understand and execute.
This Holy Grail pattern works because it is a self-fulfilling prophecy. There are billions of dollars in momentum-based mutual funds that look to “buy the dip” in strongly trending stocks. It’s our job to capitalize when the big money needs to be allocated!

A trade for the real world… This pattern helps us initiate positions in strongly trending stocks that don’t have a picture-perfect setup.
Many times after the stock market has opened, stocks bleed back into the prior day’s trading range. The ORB identifies entries when the trend continues. This is the only reliable pattern that identifies trend days.
Trend days are defined as large red or green candlesticks. When you spot one of these, hold on… these are the days that pay your mortgage.


![[Download] Angel Traders – Forex Strategy Course (2021)](https://thepremiumcourse.com/wp-content/uploads/2024/04/Angel-Traders-forex-300x228.jpg)
![[Download] Royal Exchange Forex (2021)](https://thepremiumcourse.com/wp-content/uploads/2024/04/Royal-exchange-300x228.jpg)

![[Download] FMG Traders – FMG Online Course (2021)](https://thepremiumcourse.com/wp-content/uploads/2024/04/Fmg-trader-300x228.jpg)